add

Saturday, December 31, 2011

International Combustion (India) Ltd

A fuddy duddy company run by a very complacent management, or so it would appear.

Far out but not far enough

For a 75 old manufacturing company it really hasn't gotten all that far really.

Presently a manufacturer of mineral, and material processing equipment, and gear box and geared motor drive systems, it logged in a gross turnover of Rs 1.2 bn from Rs 1 bn recorded in the preceding year. The pre-tax profit on the other hand fell to Rs 148 m from Rs 174 m previously. But I will elaborate on this point later on in this copy. And since the platinum jubilee year performance did not warrant any celebration of any sorts, the year went by like any other year in its life. The ten year financial statistics shows that the company registered an almost steady increase in net sales over the ten years barring one year that is. But the same was not necessarily true of the profitability front. The pre-tax profit has had a slightly erratic ride of sorts, over the last three accounting years.

International Combustion germinated life in India as a subsidiary of International Combustion of England. Over time the English company was apparently acquired by Asea Brown Boveri (ABB). At some point of time also the Indian operations passed into the hands of the Kolkata based Bagaria family. The family presently owns some 53% of the piddling voting stock of Rs 24 m, 2.4 m shares of Rs 10 each. That does not leave for much floating stock.

Its product line

The company makes and sells a variety of end products, but the company clubs it under two major heads - Mineral and Material handling equipment, and gear box and gear motors. The individual capacities of the products on offer appear rather apologetic, with the installed capacities of majority of the products way below the licensed capacities. The production of each and every item in turn is way below the installed capacities. Value wise the two largest manufactured end products on offer are magnetic vibrators and feeders, and gears. Of the first, it has a licensed capacity to make 1,644 nos; an installed capacity to make 600 nos, and it produced 494 nos. This item alone accounted for 29% of all sales in 2010-11.

Second in line was the sale of spares which brought in Rs 282 m of a neat 27% of the top-line. (In all probability this item had a more than disproportionate contribution to the bottom-line. But there is no way of getting to the figure, given the manner in which the company classifies spare part sales in the business reporting segment schedule). Next in the pecking order is Gear box and geared motors. Here the licensed and installed capacities match at 9,000 nos. But the production was limited to 7,923 nos. This item toted up 25% of sales. Together these three lines of business accounted for over 80% of all sales. Other items of sales which are of minor import are Mogensen sizer, and vibratory feeders, etc.

The competition

The company gets its moolah from the sale of items classified under material handling equipment. This line brought in a segment profit of 35% on sales. The sales of material handling equipment also accounted for 73% of all sales. The unit price realisation, on an average, was marginally higher than in the preceding year. But the drag on its resources emanated in the gear box segment. The segment profit here declined drastically to 8.5% from 17.5% previously, while it accounted for the balance rupee sales. This is inspite of the fact that the company sold 7,923 nos against 5,531 nos in the previous year-a volume increase of 43%. Apparently, given the standing costs the company decided to push more volumes inspite of decreasing margins to take on the competition. The unit price realisation per motor declined to Rs 30,050 on an average from Rs 39,800 previously.

The directors' report says that the company faces increasing competition in this line of business. The scene is not all that bad really. Trade debtors at year end accounted for 26% of all sales, but significantly there is no provision for doubtful debts at year end! This is swell! The company was also able to get buyers to cough up advance payments for experiencing the pleasure of buying what it has on offer. It is off-course impossible to get a fix on the price realisation that it could have obtained on spares given the complexities of arriving at even a ballpark figure - but it is fair to estimate that the sale of spares would have made the cash box jingle somewhat.

An oddball too

The company appears to be an oddball in several respects. The directors' report states that despite substantial increase in the inflow of orders, they could not be executed due to capacity constraints in its plants. The directors go on to state under the subhead “Future Outlook” that as a part of sustained efforts to attain growth through expansion of the product portfolio, the company has entered into a licence agreement with a Brazilian company to manufacture material handling equipment. Commercial production is expected to commence in the current year. The report further goes on to say that in the Bauer division various investments made by the company have significantly enhanced production capacity. The market for geared motors is large, and significant growth is expected in this area in the current and future years. With the above viewpoints in mind, the company has spent on paper Rs 151 m in the last two years on gross block updation. The total book value of the gross block at year end stood at Rs 528 m. That would make for a 40% addition to gross block in two years!

The ground realities however appear to be quite different to what is stated above. For starters, the management's comments on capacity constraints are not borne out in the schedules to the annual report. In the schedule of 'particulars in respect of goods manufactured' the production of all items, including the heavyweights is way below the installed capacities. So what capacity constraints is the company referring to please? The 'licence agreement' to manufacture material handling equipment would infer that the installed capacities would show a rise over that of the preceding year. But that is not to be. Further, the Bauer division is supposed to have enhanced its manufacturing capacities. Which manufacturing capacities is the directors' report referring to please? And what happened to the spending on capital assets for the last two years? This spending does not seem to have led to any enhanced capacities in the latter year.

The surplus cash management

The other oddity is the way it manages its surplus cash. As the company is currently unable or incapable of achieving more bang for the buck from its manufacturing facilities, the management has taken to making the funds sweat in other ways. The debt stands at Rs 83 m, up from Rs 73 m previously. The investments – all of it in liquid debt schemes stands at Rs 145 m, up from Rs 110 m previously. The cash balance at year end is however down to Rs 117 m from Rs 191 m previously. It also invested Rs 30 m in inter-corporate deposits during the year. What exactly is the benefit that the company obtains by juggling cash in this manner is not immediately evident, save the fact that other income from interest receipts and profit on redemption of investments brought in 17 m during the year. The interest payout on the other hand came to Rs 6.6 m. This is not taking into account any tax benefits that accrue on tax free receipts and the tax benefit available on interest paid out. The company during the year redeemed debt instruments worth Rs 43 m and booked a profit of Rs 3.3 m on this exercise.

If the management is really serious about taking on the competition and forging ahead, it has an abundance of dosh at its disposal, and this money is merely marking time at present. Besides, it has very low gearing. The company's share price in the secondary market is also ruling high relative to the Rs 10 face value of the share, but this is basically due to the lack of floating stock than any genuine investor demand. Besides the reserves and surplus at year end at Rs 730 m is many many times higher than the paid up equity of Rs 24 m. On paper that makes it pregnant for a prospective bonus offering. Fat chance of that happening though! 


Thursday, December 29, 2011

IGL v/s Gujarat Gas: What financials say?

In the previous article, we had discussed some operational aspects of the two leading city gas distribution (CGD) companies - Indraprastha Gas (IGL) and Gujarat Gas. Let us see how these two compare when it comes to financials.

Revenue growth

IGL has registered an average annual growth rate (CAGR) of 35% in the revenues in the last three years. The corresponding growth for Gujarat Gas is 14%. This is because IGL's gas sales volumes have increased consistently in the last three years and grown at CAGR of 22%.On the other hand, the volumes of GGas have been fluctuating, resulting in flat CAGR. While IGL has made the most of increasing demand of natural gas in industries and transport, Gujarat Gas's volumes have suffered due to gas supply constraints. However, the overall volumes (base) have been higher for Gujarat Gas till the last reported financial year.

In terms of realizations, both the companies have been successful in passing on the price hikes to the end users. The gross realizations for IGL and GGas have grown at CAGRs of 10% and 14% respectively in the last three years. IGL's growth rate is less on account of a 1% decline in realizations in FY 09. However, it has more than compensated for this by registering a 25% year on year (YoY) increase in realizations in FY11 as compared to 11% of Gujarat Gas in CY11.

Going forward, we believe that IGL has better prospects of maintaining topline growth due to its long term contracts with customers like DTC (Delhi Transport Corporation). The company is keen to acquire BG's stake in Mumbai based gas retailer Mahanagar Gas. If that comes true, we believe it will be a significant catalyst for company's growth.

Profitability front...

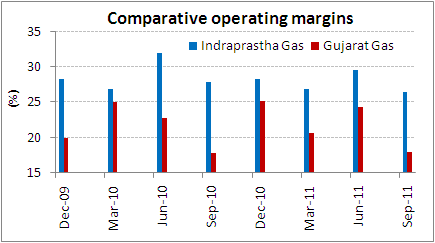
IGL's operating margins in the last five years average around 34% versus 21% for Gujarat Gas. One of the prime reasons for this is the difference in the cost of raw material (natural gas). While IGL has a significant allocation from subsidized domestic gas supplies (due to strong backing of Gail and Bharat Petroleum Corporation Ltd. (BPCL)), Gujarat Gas sources 95% of its gas at market based prices. The share of regasified liquefied natural gas (RLNG, which is almost three times costlier than domestic gas) is close to 40% in the gas portfolio for GGas.

The situation has become worse in the recent quarters...

The cost of sourcing gas has jumped from 56% to 60% from June- 11 to September- 11 for IGL. For Gujarat Gas, the costs are up from 69% to 76% for the same time period. Hence, Gujarat Gas's gross gas margin spreads have shrunk from 5.9 per scm (standard cubic metre) in the June quarter to 4.7 per scm in the September quarter. While the spreads have shrunk for IGL as well, they still stand much higher than GGas ( Rs 7.8 per scm in quarter ending September 11).

Going forward, while margins for both the companies are expected to remain under pressure, we expect Gujarat Gas to take a harder hit on account of high share of imported gas priced in dollar and depreciating rupee.
Source: Ace Equity, Equitymaster

At the bottomline level, IGL has historically been the winner with average net profit margins at 18% in the last five years as compared to 12% of Gujarat Gas. In the last reported year, GGas has remarkably narrowed the difference (PAT margins for GGas came at 13.8% in CY 10 versus 12.1% in the previous year due to higher volumes and better realisations. IGL's PAT margins however declined to 13.2% in FY11 from 17.6% in the previous year on account of high raw material and spurt in finance costs). However, going forward, we believe it will be difficult for GGas to sustain its margins due to operational constraints mentioned above.

Gearing levels....

IGL has got high interest expenses (as compared to GGas) because of relatively higher level of debt on its balance sheet. The total debt as a percentage of equity for IGL has risen from 7% in FY10 to 46% in the end of March 2011. The gearing levels for Gujarat Gas seem moderate in comparison (24% in Dec 10). However, we believe this is not negative for IGL since it is using the money on capacity expansions; the next growth driver of city gas distribution story. In the last reported year, the capex for IGL was almost seven times of GGas. It has grown at a CAGR of 112% for IGL in the last two years versus 4% for GGas.

Besides, IGL has been delivering good returns on capital employed (RoCE) that justify its expansion and high financial leverage. The average five year RoCE stand at 43% versus 32% for Gujarat Gas. Though in the last year (when the gearing levels for IGL shot up and Capex doubled in a year), IGL has offered RoCE of 34% , less than 38% for Gujarat Gas, we believe it should not be a matter of concern as it is too early for the incremental revenues and profits from Capex to reflect in the earnings statement.

Rewarding shareholders....

Gujarat Gas seems to have rewarded shareholders with stellar dividend payouts. The payout ratio for Gujarat Gas has catapulted from 12% to 60% in the last two years. IGL however, is reinvesting more cash in the business and the payout ratio has been shrinking in the last few years (from 32.5% in FY09 to 26.9% in FY11). The yields too have moved accordingly (up from 1.3% to 3% for GGas and down from 3.7% to 1.7% for IGL in the last two years).

We believe that IGL's conservative stance in dividend payments is well in line with its growth plans and will pay the stakeholders in the years to come when full benefits of profits reinvestment in the business will be realized.

And now the valuations....

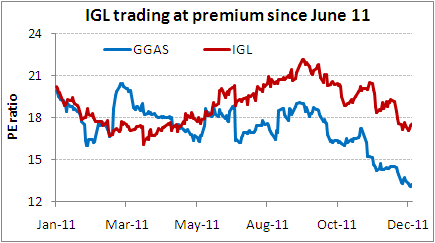
Historically, GGas has been trading at a premium over IGL w.r.t PE (price earnings) multiple. However, since June, IGL has overtaken GGas and has been consistently trading at a higher ratio. While both the companies are in the same industry, we believe that current premium that IGL enjoys over GGas is well justified.

*On the basis of trailing 12 months.
Source: Ace Equity

This is because of the difference in their risk profiles. GGas gas portfolio contains a significant share (~40%) of costlier and imported gas because of which the raw material costs are expected to be higher. It is not so easy for GGas to pass on the price hike to the end users, around 78% of which are industrial.

On the other hand, IGL has access to relatively cheaper domestic supplies and has less share of imported gas (77% to 78% of IGL's business is CNG segment which gets 85% of the supplies from domestic sources and 15% from LNG). A high proportion of CNG segment makes it easier for IGL to pass on price hikes due to huge differential between diesel/petrol and CNG prices.

To summarize, the positives that IGL enjoys over GGas are backing of promoters like GAIL and BPCL, higher share of domestic gas in the gas sourcing portfolio and better access to cheap domestic and imported gas supplies going forward. On the sales front, around 80% of IGL's supplies serve Public transport (CNG), unlike GGas that mainly caters to industrial users, making it easier for IGL to pass on the price hikes. The backing of promoters like GAIL and BPCL make it relatively more secure in terms of contracting gas supplies. The recent long term LNG contract signed by GAIL with US firm makes things a little easier for IGL. On the other hand, the recent news of BG's decision to sell its stake has made investors a little cautious regarding GGas.

Hence, at present, IGL seems to be better placed than GGas in the gas distribution value chain and may continue to do so in the long term as well.

Tuesday, December 27, 2011

Hindusthan National Glass: Research Meet Extracts

We recently met Hindusthan National Glass Ltd (HNGL), one of the leading container glass bottle manufacturers in India, so as to get a broader idea about their business and industry in general.

Here are the key takeaways:-

Snapshot of the business: HNGL is a leading player in the container glass bottle manufacturing in India with 55% market share. The company basically manufactures container glass bottles which are used across various industries namely Liquor, Beer, Food, Pharma and Others. HNGL’s marquee client list comprises of top companies like UB Group, Radico Khaitan, HUL, Nestle, Pepsi, Coke etc.

Right now, the company has six manufacturing units and the current capacity is about 2,825 tonnes per day (TPD). Going forward, the company plans to expand its overall capacity to about 6,000 TPD by FY14/15. Apart from container glass bottles the company also manufactures float glass which is basically toughened glass used in automobile and construction space. Additionally, it also supplies capital goods & spares to the glass industry.

Key Takeaways:
  • Although HNGL is a market leader in the container glass manufacturing space, it has witnessed a decline in market share over the last few years. It may be noted that the market share of the company declined from about 65% to about 55% within a span of 2-3 years. As the company was a bit conservative in its capacity expansion plans, unorganized market captured the market share of the company. As a measure to regain the market share, the company has finally decided to increase its capacity, a step in the right direction. Plans to increase capacity is likely to boost revenue growth over the next 2-3 years.
  • Power & Fuel cost are an important source of raw material for the company. The furnace used to manufacture glass typically runs on oil. So, whenever oil prices turn volatile margins of the company are impacted to that extent. However, going forward the company has decided to switch from oil to natural gas so as to eschew the volatility in oil prices. The process is ongoing and once it is completed, the company is likely to save Rs 500-700 m per year on a per plant basis. This is likely to bring in some stability in margins.
  • As HNGL is a market leader it has pricing power. Any cost escalations are passed onto the customers on a timely basis. However, it takes a period of about 2-3 months before the benefit of increased realization is witnessed in the margins. The realizations over the last three years have averaged in the region of 16,300 per ton. Management is of the opinion that if the raw material prices increase from current levels, it has further headroom to increase prices. In fact, the company has already taken an increase of about 10-12% in the month of February.
  • Typically 1 TPD of capacity requires capex in the region of Rs 10 m. As the company plans to add about 3,000 TPD of capacity, additional capex required would be in the region of Rs 30 bn. Management is confident of meeting the capex requirement through debt, equity and treasury shares which it has at its disposal.
  • Although the company is not a large force to reckon with in the float glass business (market share of about 15%), it has plans to increase its market share in the float glass business to about 40% in few years from now.
  • Both top line and bottom line are expected to grow in the region of 10-15% during FY12. Management expects EBITDA margin to increase to about 23-25% in FY12.
  • Currently, exports contribute negligible portion of the company’s revenues. However, going ahead it plans to increase its market share in the overseas markets and is looking out for a few acquisitions abroad.
  • Until recently, the company enjoyed tax benefits across few of its plants. However, the benefit is set to expire soon and from now on HNGL will be paying the corporate tax rate.
  • Although the current D/E ratio is 0.54x the management has shown willingness to leverage its balance sheet in order to meet the capacity expansion plans. Even equity dilution is on the cards to meet the large scale capacity expansion plans.

Common myths about SIP investing debunked!!

"Myths and creeds are heroic struggles to comprehend the truth in the world."- Ansel Adams

In the world filled with information galore and cultural change, many of us develop our own set of beliefs and judgements. While that's great to do, it is vital to recognise whether you are living with plain truth or mere delusions.

In the world of investments too, today we are exposed to galore of information. Take for instance when you step out for a social gathering; you may have come across individuals discussing about the stock markets, which sectors to invest, which market capitalisation segment (i.e. large caps, mid caps or small caps) to invest in, or simply even which avenue of investment to deploy money. And mind you, while we do recognise that while everyone has view on all these, we think that for your financial well-being it is necessary that you conduct enough research, thus enabling you take a wise investment decision suiting your investment objectives. This is because if incorrect information sometime shared by your friends and broker, may blind your ability to understand things in the right perspective, thus guiding you on the wrong path.

In the present volatile market conditions, while there's lots talked about the market outlook it imperative for you not only to take a well informed decision, but also be free from myths. As in our last article while we have explained you how Systematic Investment Plan (SIPs) can help you manage the market volatility, over here we thought of sharing some of the common myths which we have experienced some investors have while approaching SIPs

.
Myth no. 1 : Only Small investors go in for SIP

Please note that SIP stands for Systematic Investment Plan (SIP) and
not Small Investors Plan. Hence, it is incorrect to be under the delusion and arrogance that SIP, is meant only for small investors.

Remember those good old days, where our parents subscribed us to a good, regular saving habit by buying us a piggy bank, where we all saved some money every day or week or month to build a corpus at the end of a particular period. But the fact was the regular deposits in your piggy bank, did not earn a rate of return.

In case of SIPs (Systematic Investment plans) too, if you go by the same logic of the piggy bank, you would realise that your money saved in a systematic manner - may be daily, monthly, quarterly, for a said tenure (period of SIP) will help you to build a corpus earning a rate of return, in order to attain your financial goal.
Myth no. 2 : Rupee cost averaging can be done in a stock itself - then why SIP?

It's noteworthy that, certainly you can bet on equity, but diversification through mutual funds would help you to reduce the stock specific risk which you are exposed in direct equity (stocks). Moreover, as per the market cap bias (i.e. large cap, mid cap and small cap) which a fund follows, you can also strategically structure your portfolio depending upon your risk appetite. Similarly, you can structure your portfolio on the basis of the style (viz. value, growth, blend, opportunities, flexi-cap, multi-cap etc.) of investing followed by the mutual fund. And by adopting the SIP mode of investing for mutual funds, you'll benefit from rupee cost averaging and compounding.

Remember a SIP experimented on single scrip, can expose you to more volatility unlike SIP in mutual funds which reduces the risk, due to diversification provided by mutual funds.
Myth no. 3 : SIP mutual funds are different from lump sum mutual funds

Well many have this delusion. The fact is, there are no special schemes for SIP investments. SIPs are just a mode of investing. You can enroll for a SIP in any mutual fund scheme, but ideally you should select a mutual fund taking into account the qualitative parameters such as investment processes and system, fund manager's experience, uniqueness of the products etc., along with quantitative parameters such as returns, risk, average Assets Under Management
(AUM), liquidity, expense ratio, portfolio characteristics etc.

Remember, there's more than just a return while selecting a mutual fund scheme for your portfolio.
Myth no. 4 : Lump sum investments cannot be done in a scheme, where a SIP account exists

It is noteworthy that SIP, is just a mode of investing in mutual funds. Hence, pumping a lump sum amount to a mutual fund where your SIP exists is possible. So, say you have a SIP of Rs. 1,000 going on in a mutual fund scheme and suddenly you have a surplus of say Rs. 50,000, then you can pump a lump sum amount to your ongoing Rs. 1,000 SIP account.
Myth no. 5 : I'll be penalised if I miss one or two SIP dates

While enrolling for the SIP mode of investing you are required to provide your ECS mandate form along with the common application form. Your SIP details (as selected) are already mentioned in the ECS mandate, thus your bank at regular SIP dates keeps debiting the SIP amount in favour of the fund where you have opted a SIP. Hence, the question of missing dates doesn't arise. Now for some reason if you are not maintaining a balance in your bank account for your SIP to be debited, you would simply miss that SIP instalment, but your SIP account will remain active and further SIPs (subject to your bank balance) will be debited to your bank account. So, it's not like the EMI (Equated Monthly Instalment) of your loan, where you miss an instalment; you are penalised.

Remember, SIP infuses discipline in investing and is entirely at your free will.
Myth no. 6 : I'll accumulate through SIP and liquidate through SWP during retirement.

Well, if you adopt this financial planning strategy, you are bound to face nightmares during your retirement. It is noteworthy that, as you approach retirement your appetite for risk reduces, as your number of years of earning life decreases. Hence having savings lying in equity mutual funds during retirement years can be risky. In order to maintain a lifestyle post-retirement, you should transfer your savings to low risky asset classes such as debt and cash from a high risk asset class like equity.

Remember to adopt the right strategy while planning your finances - think wise!
Myth no. 7 : Markets are high to start a SIP

Well, if that's what you think, then you should be starting a SIP immediately. That's because as the market corrects you would by accumulating more number of units, with every fall in the NAV, thus enabling you to lower you average purchase cost. And, as the markets, post the correction surge once again, you would gain as the yield will work to be higher.

Remember by adopting the SIP route for mutual fund investments, you are shielding your portfolio against the wild swings of the markets. Don't unnecessarily try to time the markets as it is not always possible.
Myth no. 8 : In a tax saver SIP, entire money can be withdrawn after 3 years

In case of a SIP in tax saving mutual funds (commonly known as Equity linked Saving Schemes - ELSS), very often a delusion exists that, the entire investment in a tax saving mutual fund can be withdrawn once the lock-in period is over. But that's not the case!

The fact is: your every instalment of SIP should have completed the lock-in tenure. So say if you put in Rs. 5,000 through SIP in the month of January 2012, the lock-in period for only 1 instalment (i.e. January 2012) will get over on January 2015. While other SIP instalments need to complete 3 years as well.
This article is authored by PersonalFN, the most credible source for unbiased research on mutual funds. PersonalFN, which has been researching funds for over a decade now, is also our research partner for the newly launched mutual fund portfolio recommendation service, Strategic Fund Report.

Saturday, December 24, 2011

Motilal Oswal 16th Wealth Creation Study on Blue Chips

 Motilal Oswal 16th Wealth Creation Study on Blue Chips

http://www.filedropper.com/motilaloswalwealthcreationstudy

Rakesh Jhunjhunwala Portfolio: Loss Rs. 700 crores!

We’ve been tracking Rakesh Jhunjhunwala‘s portfolio since January 2011. It’s not been a pleasant time. We earlier reported how Rakesh Jhunjhunwala‘s favourite stocks – especially those that he had publicly recommended his disciples to buy, had fallen out of favour and registered steep losses. What troubled Rakesh Jhunjhunwala was not so much the loss in his own portfolio but the fact that his disciples had suffered losses in their personal portfolios by following his public recommendations. Then we exposed the Bears for targeting Rakesh Jhunjhunwala‘s portfolio. We pointed out how the Bears had spread rumors that Rakesh Jhunjhunwala had speculated heavily in Silver futures and Nifty futures and that his heavy losses had forced him to liquidate his favourite stocks. 

Since then we were petrified to check Rakesh Jhunjhunwala‘s portfolio because we knew that things were not looking pretty at all. However, we managed to summon the courage to take a peek and out worst fears came true;
Rakesh Jhunjhunwala‘s portfolio has suffered a loss of Rs. 700 crores!


Rakesh Jhunjhunwala

The worst cut came when Rakesh Jhunjhunwala‘s most-trusted lieutenant, his man-of-crisis, his crown jewel, Titan Industries, buckled in the face of the fearsome Bear onslaught and lost a mammoth Rs. 119 crores. Titan Industries has been very vulnerable to the Bear attack on two fronts. First, the soaring prices of Gold and diamonds has meant that Titan‘s customers have postponed their purchases. Second, the steep depreciation in the value of the Rupee has meant that Titan‘s import bill has shot up. The dual whammy has lent considerable ammunition to the Bears to attack Titan Industries.
All the other stocks in Rakesh Jhunjhunwala‘s portfolio also seem to have lost their nerve after seeing Titan‘s surrender. Bilcare lost Rs. 96 crores, Hindustan Oil & Gas lost Rs. 91 crores, Lupin lost Rs. 65 crores, Geojit lost Rs. 61 crores and even Karur Vyasa Bank could not salvage the situation and lost Rs. 57 crores. The only stock that held on to its gains was CRISIL, with a gain of Rs. 165 crores.

Of course, lay investors must take note of the fact that at heart Rakesh Jhunjhunwala is cold and emotionless when it comes to money matters. In the great crisis of 2008, Rakesh Jhunjhunwala had seen a worst situation with his precious portfolio being plundered of several hundreds of crores. However, Rakesh Jhunjhunwala never lost his nerve. Like a poker player, he kept his cool, analyzing matters with a rational mind. He also bought more of his favourite stocks. And when the tide turned, Rakesh Jhunjhunwala made a staggering Rs. 1,000 crores gain! Will history repeat itself? We are sure it will!

Particulars Investments Todays Gain Overall Gain Latest Value
Stocks     39,832,151,874 -164,457,741 (-0.50%) -6,964,150,640 (-17.48%) 32,868,001,234

Company Live Price Change Quantity Inv. Price Day’s Gain Day’s
Gain%
Overall Gain Overall Gain% Latest Value
CRISIL 901.40 -1.95 5500000 600.58 -10,725,000 -0.22% 1654510000 50.09% 4,957,700,000
Kajaria Ceramic 100.15 -0.10 2502642 73.95 -250,264 -0.10% 65569220 35.43% 250,639,596
Adinath Exim Re 17.10 -0.00 250000 16.00 0 0.00% 275000 6.88% 4,275,000
Agro Tech Foods 384.95 -4.20 2003259 375.05 -8,413,688 -1.08% 19832264 2.64% 771,154,552
Titan Ind (2) 163.25 -3.90 72521220 179.75 -282,832,758 -2.33% -1196600130 -9.18% 11,839,089,165
Lupin 434.55 +21.20 13639175 482.45 289,150,510 5.13% -653316483 -9.93% 5,926,903,496
Stride Arcolab 398.85 -15.05 500000 448.60 -7,525,000 -3.64% -24875000 -11.09% 199,425,000
Rallis India 124.95 -3.00 7465880 144.41 -22,397,640 -2.34% -145286025 -13.48% 932,861,706
Praj Industries 72.25 -1.10 14460624 84.25 -15,906,686 -1.50% -173527488 -14.24% 1,044,780,084
Karur Vysya (2) 366.95 -0.15 5629224 469.42 -844,384 -0.04% -576826583 -21.83% 2,065,643,747
VIP Industries 90.20 -3.20 8215000 133.73 -26,288,000 -3.43% -357598950 -32.55% 740,993,000
Prime Focus 42.20 -3.00 882500 64.50 -2,647,500 -6.64% -19679750 -34.57% 37,241,500
Zen Tech 103.00 -2.05 900000 164.30 -1,845,000 -1.95% -55170000 -37.31% 92,700,000
Geometric 47.55 -1.40 4900000 78.15 -6,860,000 -2.86% -149940000 -39.16% 232,995,000
Delta Corp 64.90 +2.05 7500000 106.95 15,375,000 3.26% -315375000 -39.32% 486,750,000
Ion Exchange 94.10 -3.65 650000 172.65 -2,372,500 -3.73% -51057500 -45.50% 61,165,000
Viceroy Hotels 20.75 -0.60 4750000 39.25 -2,850,000 -2.81% -87875000 -47.13% 98,562,500
Reliance Broadc 46.10 -3.25 1750000 88.45 -5,687,500 -6.59% -74112500 -47.88% 80,675,000
Geojit BNP (2) 15.85 -0.35 36000000 32.90 -12,600,000 -2.16% -613800000 -51.82% 570,600,000
Autoline Ind 98.35 -3.90 1251233 206.40 -4,879,809 -3.81% -135195725 -52.35% 123,058,766
Hind Oil Explor 111.05 -1.45 7272416 236.40 -10,545,003 -1.29% -911597345 -53.02% 807,601,797
Orchid Chemical 144.05 -5.45 2500000 314.65 -13,625,000 -3.65% -426500000 -54.22% 360,125,000
SREI Infra (2) 27.70 -0.00 2250000 60.75 0 0.00% -74362500 -54.40% 62,325,000
Mcnally Bh Engg 89.00 -2.60 480000 225.35 -1,248,000 -2.84% -65448000 -60.51% 42,720,000
Punj Lloyd 41.50 -1.15 3790000 111.85 -4,358,500 -2.70% -266626500 -62.90% 157,285,000
Alphageo 60.95 -3.35 125000 175.90 -418,750 -5.21% -14368750 -65.35% 7,618,750
A2Z Maintenance 108.55 -5.75 1400000 327.15 -8,050,000 -5.03% -306040000 -66.82% 151,970,000
IFCI 21.55 -0.35 7500000 66.85 -2,625,000 -1.60% -339750000 -67.76% 161,625,000
Provogue 19.85 -0.35 1900000 64.15 -665,000 -1.73% -84170000 -69.06% 37,715,000
Pantaloon (DVR) 89.00 -5.95 211000 316.90 -1,255,450 -6.27% -48086900 -71.92% 18,779,000
Bilcare 179.00 -5.75 2002925 659.50 -11,516,819 -3.11% -962405463 -72.86% 358,523,575
NCC 36.90 +0.05 5000000 151.85 250,000 0.14% -574750000 -75.70% 184,500,000


Friday, December 23, 2011

Sintex Industries: FCCB impact explained

The stock price of Sintex Industries has taken a severe beating due to concerns over widening mark to market (MTM) losses on its Foreign Currency Convertible Bonds (FCCBs) amidst significant Rupee depreciation. In this note, we analyze how the FCCB losses will impact earnings and consequently, the valuations of the company.

Background

The company issued FCCBs aggregating to US$225 m in 2008. These FCCBs were due for redemption in 2013 and the conversion price was reset at Rs 247 per share. At that point in time, the exchange rate was in the region of Rs 44-45 a dollar. However, the recent depreciation in Rupee has resulted in a significant increase in MTM losses, thereby impacting the profitability of the company. The following table compares the FCCB gain/loss at an average exchange rate prevailing during the last 3 quarters.

Year Avg Rs/$ Exchange rate FCCB Gain/(Loss) (Rs m) Profit/(Loss) for the period (Rs m)
1QFY12 44.89 Not disclosed 946
2QFY12 45.79 -596 388
3QFY12 50.85 Huge loss expected Yet to be announced
Source: Oanda, Company reports and Equitymaster

Looking at the table (depicts significant rupee depreciation) it is clearly evident that even if the company reports operating margins in the region of 17-18% (past 5 year average) it will not be able to absorb the notional exchange loss on FCCBs and may report a loss during the current quarter.

Redemption scenario explained


Considering that the conversion price (Rs 247) is significantly higher that the current market price (Rs 71) we do not expect equity dilution/conversion in 2013. As a result, the company will have to redeem the FCCBs. Taking a pessimistic approach, we assume an exchange rate of Rs 50/US$ in 2013. This translates into rupee debt of Rs 11.2 bn (US$225m*50). Add to that a redemption premium of 25% (inclusive of implicit interest cost) and the total outflow could be in the region of Rs 14.0 bn.

Further, let us assume that the company will refinance the entire amount at maturity with debt at an interest rate of 9%. It may be noted that over the last 10 years, the company has raised debt (exclusive of FCCBs) at an average cost of about 7.5%. Also note that here we do not take into account the surplus cash of Rs 5 bn (unutilized amount of FCCB issue which the company can use for redemption) lying idle on the balance sheet as fixed deposit assuming that it will be used for working capital requirements. Thus, after refinancing at a higher interest rate, the net impact on the profits would be Rs 14.0 bn * 0.09 = Rs 1.3 bn, both in FY 13 and FY14.

Why isn't the company refinancing now?

In order to avoid exchange losses, the company has an option to refinance the FCCB debt straight away. However, we believe that refinancing doesn't make sense now. If the FCCB debt is refinanced now it will hurt the profitability as the company will have to borrow in local currency where interest rates are higher. Further, refinancing would mean that the increase in interest expenses will be actual in nature while FCCB losses are notional. Secondly, if the Rupee appreciates by 2013, the actual outgo on FCCB redemption too can be less than what it can be now. Hence, it's logical to stay put and utilize the cheaper debt (FCCB) rather than refinance the same.

Our view

Assuming that the FCCB will be up for redemption in 2013, we have revised our estimates accordingly. The following table highlights the key changes in financials post redemption.

Particulars Year Previous Estimate (Rs m) Revised Estimate (Rs m) Comments
Debt FY13 29,551 33,567 The debt levels will increase as the company will have to refinance the FCCB debt amidst significant Rupee depreciation
FY14 30,527 34,543
Interest FY13 1,365 2,631 The interest expenses will increase as the cheaper FCCB debt will be replaced with local currency debt
FY14 1,434 2,700
EPS* FY13 18.9 13.7 Higher interest expenses will dent bottomline
FY14 21.7 15.4
* EPS estimates are in Rupees

Based on these revised estimates, we reduce our target price downwards to Rs 185 per share. Nonetheless, considering the upside potential from current price levels and future growth prospects, we maintain over positive view on the stock from a 2-3 year perspective.

 STOCK IDEA:        Apollo Pipes Ltd 349.00 AROUND 325 ITS A GOOD BUY FOR LONGTERM   ...